Page 1 of 1
Confused about response time charts.
Posted: 12 Jun 2021, 09:03
by MrK
So I am using an Asus VG259QM and have been using rtings to check the response time for the different OD settings.
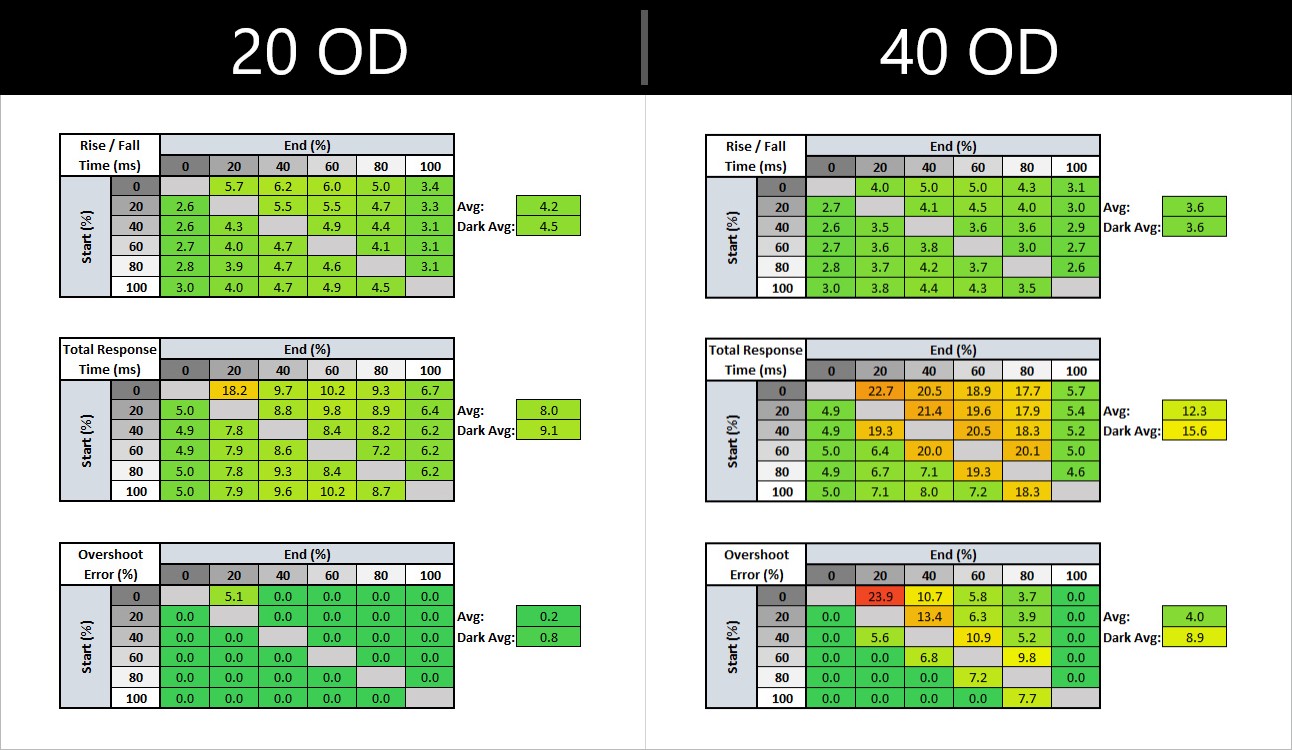
The problem is though, for the 60hz OD tests they claim that 40 OD is the best OD setting but take a look at the 40 OD chart compared to the 20 OD chart.
- Combined.jpg (214.08 KiB) Viewed 1708 times
I am confused why they said that 40 OD is the best setting if the total response time is nearly double the 20 OD setting. Am I reading the chart wrong?
Re: Confused about response time charts.
Posted: 12 Jun 2021, 12:38
by Chief Blur Buster
MrK wrote: ↑12 Jun 2021, 09:03
I am confused why they said that 40 OD is the best setting if the total response time is nearly double the 20 OD setting. Am I reading the chart wrong?
The last chart is not response time. The last chart is overshoot error in percentage.
Sometimes the overshoot is very faint (as the 2nd chart says), and so recovery time from faint overshoots (3rd chart) isn't as important when the overshoot is faint to begin with.
There's quite a lot of green and gentle-yellows in the 2nd chart, so that's pretty good. A little faint coronas sometimes is preferable over worse ghosting, depending on the pros/cons. The charts are sometimes hard to interpret.
For more information about overdrive/corona artifacts see
LCD Overdrive Artifacts.
Re: Confused about response time charts.
Posted: 12 Jun 2021, 12:55
by MrK
Chief Blur Buster wrote: ↑12 Jun 2021, 12:38
MrK wrote: ↑12 Jun 2021, 09:03
I am confused why they said that 40 OD is the best setting if the total response time is nearly double the 20 OD setting. Am I reading the chart wrong?
The last chart is not response time. The last chart is overshoot error in percentage.
Sometimes the overshoot is very faint (as the 2nd chart says), and so recovery time from faint overshoots (3rd chart) isn't as important when the overshoot is faint to begin with.
There's quite a lot of green and gentle-yellows in the 2nd chart, so that's pretty good. A little faint coronas sometimes is preferable over worse ghosting, depending on the pros/cons. The charts are sometimes hard to interpret.
For more information about overdrive/corona artifacts see.
I specifically confused about the middle charts for both OD settings. For 20 OD it shows for Total Response Time (ms) that the average is 8.0 and the Dark Average is 9.1. But for 40 OD which they claim is better, it actually has a higher delay at 12.3 Average and 15.6 Dark Average which is what is confusing me. I don't care much about the overshoot errors as it is completely unnoticeable to me on both of the settings. I can only notice overshooting at 80 OD or higher.
Re: Confused about response time charts.
Posted: 12 Jun 2021, 13:23
by Chief Blur Buster
MrK wrote: ↑12 Jun 2021, 12:55
I specifically confused about the middle charts for both OD settings. For 20 OD it shows for Total Response Time (ms) that the average is 8.0 and the Dark Average is 9.1. But for 40 OD which they claim is better, it actually has a higher delay at 12.3 Average and 15.6 Dark Average which is what is confusing me. I don't care much about the overshoot errors as it is completely unnoticeable to me on both of the settings. I can only notice overshooting at 80 OD or higher.
GtG curve shape can be a big issue. A fast rise-fall curve with a slower finish-out.
Also, GtG is measured from 10% to 90% as seen at
www.blurbusters.com/gtg-vs-mprt
I need to check how they measured (different sites such as RTINGS, HardwareUnboxed, TFTCentral use different GtG measurement criteria for their GtG heatmapping). But I suspect rise/fall is the 10%->90% and total is 0%->100%. The human eye mainly sees the 10%->90% speed, although some are annoyed by ghosting/coronas of the 0%->100%