Math Formulas for phosphor decay & LCD GtG [provided!]

Advanced display talk, display hackers, advanced game programmers, scientists, display researchers, display manufacturers, vision researchers & Advanced Display Articles on Blur Busters. The masters on Blur Busters.
ScepticMatt
Posts: 37
Joined: 16 Feb 2014, 14:42

Re: Seeking Math Formulas for phosphor decay & LCD GtG

Post by ScepticMatt » 07 Mar 2014, 01:38

spacediver wrote: I thought they used the SMPTE-C phosphors and the BVM-EBU phosphors. From what I read in one paper (I can dig it up if you like), the P22 is a broad designation and refers to a class of phosphors. Not sure how much they differ in chromaticity or decay function tho. Very hard to find info on this.
I'm not sure, maybe you're right.
Well, the sheets says for:
PVM-9L3/PVM-9L2: HR Trinitron, P22 luminescentmaterial (PVM-9L3)
PVM-14L2: Trinitron, P22 luminescent material
PVM-20L2: Trinitron, P22 luminescent material

There are 5 P22s as far as I can tell, 3 reds 1 blue 1 green.

spacediver
Posts: 505
Joined: 18 Dec 2013, 23:51

Re: Seeking Math Formulas for phosphor decay & LCD GtG

Post by spacediver » 07 Mar 2014, 02:08

I believe the cheaper models had the p22 phosphors, but the higher end BVMs and perhaps some of the PVMs had the SMPTE-C / EBU phosphors, which had tighter tolerances for chromaticity.

Here is some interesting information (including modeling and measurements of P22 phosphors)

http://www.cl.cam.ac.uk/~mgk25/ieee02-optical.pdf

Of interest:
The user manual of the VGA CRT color monitor [10] that I used in the measurements described in the following identifies its phosphor type simply as “P22”. This is an old and obsolete designation referring to an entry in an early version of the Electronic Industries Alliance (EIA) phosphor type registry. It merely describes the entire class of phosphors designed for color TV applications.

The more modern Worldwide Type Designation System (WTDS) for CRTs [12] calls the old P22 family of phos-
phors “XX” instead and distinguishes subclasses. The most recent EIA TEP-116-C phosphor type registry [13] lists seven different color TV RGB phosphor type triples designated XXA (P22 sulfide/silicate/phosphate), XXB (P22 all-sulfide), XXC (P22 sulfide/vanadate), XXD (P22 sulfide/oxysulfide), XXE (P22 sulfide/oxide), XXF (P22 sulfide/oxide modified) and XXG. In addition, it contains partial information on composition, emission spectrum, decay curves and color coordinates for at least 15 further RGB phosphor-type triplets designated XBA, XCA, etc. that were developed for data-display applications and that differ somewhat from the TV standards in their color. Unfortunately, the original manufacturer of the tested monitor has not yet been able to answer my question on which exact P22 variant was used.

ScepticMatt
Posts: 37
Joined: 16 Feb 2014, 14:42

Re: Seeking Math Formulas for phosphor decay & LCD GtG

Post by ScepticMatt » 07 Mar 2014, 02:46

Wow, that's just the paper I based my earlier calculations on in the first place. (though a slightly higher quality version)
I guess I'd just have to read through the whole thing first :)

Edit: Thanks , I finally got it (using the updated constants from newer version)
Image

User avatar
Chief Blur Buster
Site Admin
Posts: 11653
Joined: 05 Dec 2013, 15:44
Location: Toronto / Hamilton, Ontario, Canada
Contact:

Re: Seeking Math Formulas for phosphor decay & LCD GtG

Post by Chief Blur Buster » 08 Mar 2014, 14:51

Thanks!

I contacted another guy and was told that GtG is hard to model. I, however, would like to attempt to do a very rough approximation, which probably wouldn't be perfect. Formulas for GtG is hard to find, but if you can find anything remotely similiar, that'd be appreciated too!

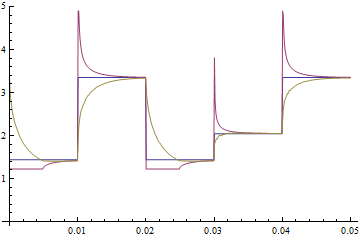
Let's use electronics as a rough/approximate analog. Squarewaves often have ripples at the end. Are you able to find any formulas for voltage transitions including ripple at the end?

GtG can have behaviors like:
- Slow curve; traditional LCD GtG
- Fast cliff; almost resembling squarewave -- e.g. 1ms LCD on a 16.7ms refresh cycle (60Hz)
- Ripples at the end (overshoot) - amplified during overdrive
- Ripples are very different at top end versus center versus bottom end. Ripples often don't go beyond full-black and full-white. So an anntenuator formula would be needed that depends on the values
- GtG inertia can bleed over multiple refresh cycles. So sequence can matter. GtGtGtG ... transition back to black is faster if you do BBWB than if you do WWWB since often the W is an incomplete transition white in BBWB (four refresh cycles: black, black, white, black) so returning to black is faster.
- GtG can contain minor stairstepping artifacts.

About the GtG stairstepping effect -- example 
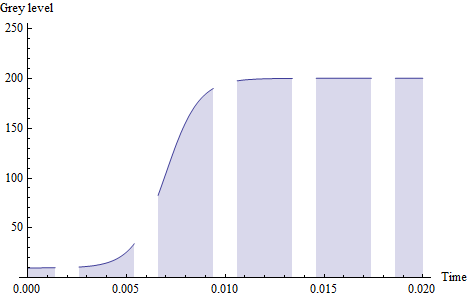
http://www.testufo.com/blurtrail on pale yellow on an off-blue background, non-strobed. This is because each refresh gives a new "kick" to the LCD pixel. Transition is sudden during each voltage push. So you see a gradual transition curve interrupted with minor stairstep artifacts at, say, 8.3ms intervals (caused by the new voltage push on the pixel at the discrete refresh intevals). e.g. GtG from black to white can be quick transition from 0% to 95% white, then between refreshes a slow floating transition from 95-96% white, then the next refresh cycle gives it a quick transition from 96% white to 99% white, then between refreshes a slow floating transition from 99% white to 99.1% white, then the third refresh cycle gives it a quick kick from 99.1% white to 99.9% white (falling below noisefloor at that point, 99.9% white human indistinguishable from 100% white). I've seen this in GtG graphs before. Newer LCD's are faster, so the stairstepping artifact is much more minor and hard to see, but you can discover the GtG starstepping artifact for certain color combinations when you play with http://www.testufo.com/blurtrail -- the motion blur then shows minor ghosts (some forms of LCD ghosts are simply the GtG stairstepping artifact manifesting itself). It's harder to find on many new LCDs but easy to find on older LCDs. The GtG stairstepping occurs when the motion blur trail has sharp steps in them, e.g. regular persistence blur followed immediately by a sharp boundary to a ghost blur (remnant GtG from last refresh), then sometimes another sharp boundary to a third ghost blur (remnant GtG from three refresh ago). The sharp boundaries between the tiered blurs is the voltage pulses onto the pixel at the refresh intervals. I can model for these GtG stepping effects separately using a separate "push" formula that works on the original formula.

It would not be a catchall for all LCDs as response on VA can be very different from TN very different from IPS, but it would be a more realistic mathematical approximation of generic LCD response, than any GtG formulas has ever done before. You are much better at formulaic creation than I am, but I immediately recognize that GtG transitions can be simulated/modelled much more accurately than they currently are today. Maybe even help trailblaze a new science paper, as co-author (if a scientist/researcher is willing to work together with me).
Head of Blur Busters - BlurBusters.com | TestUFO.com | Follow @BlurBusters on Twitter

Image
Forum Rules wrote:  1. Rule #1: Be Nice. This is published forum rule #1. Even To Newbies & People You Disagree With!
  2. Please report rule violations If you see a post that violates forum rules, then report the post.
  3. ALWAYS respect indie testers here. See how indies are bootstrapping Blur Busters research!

ScepticMatt
Posts: 37
Joined: 16 Feb 2014, 14:42

Re: Seeking Math Formulas for phosphor decay & LCD GtG

Post by ScepticMatt » 08 Mar 2014, 15:31

I haven't looked into G2G. I wouldn't rule it out to find something yet.
Edit: in one minute, I found this:
Mathematical modeling of the LCD response time
http://hal.archives-ouvertes.fr/docs/00 ... _20087.pdf

User avatar
Chief Blur Buster
Site Admin
Posts: 11653
Joined: 05 Dec 2013, 15:44
Location: Toronto / Hamilton, Ontario, Canada
Contact:

Re: Seeking Math Formulas for phosphor decay & LCD GtG

Post by Chief Blur Buster » 08 Mar 2014, 16:05

ScepticMatt wrote:I haven't looked into G2G. I wouldn't rule it out to find something yet.
Edit: in one minute, I found this:
Mathematical modeling of the LCD response time
http://hal.archives-ouvertes.fr/docs/00 ... _20087.pdf
Thanks!

Lately, the curves have become more complex, especially with strong response time acceleration. And transitions appear to have become more symmetric in both directions they they used to be (e.g. bright->dark is getting closer to speeds of dark->bright). Other times, there's strange abberations.

For example, a more recent LCD. IIRC, a panel rated at 2ms, some transition pair take less 1ms, while there are some abberations (e.g. 15ms).

Image
Head of Blur Busters - BlurBusters.com | TestUFO.com | Follow @BlurBusters on Twitter

Image
Forum Rules wrote:  1. Rule #1: Be Nice. This is published forum rule #1. Even To Newbies & People You Disagree With!
  2. Please report rule violations If you see a post that violates forum rules, then report the post.
  3. ALWAYS respect indie testers here. See how indies are bootstrapping Blur Busters research!

ScepticMatt
Posts: 37
Joined: 16 Feb 2014, 14:42

Re: Seeking Math Formulas for phosphor decay & LCD GtG

Post by ScepticMatt » 08 Mar 2014, 16:43

Here's a selection of papers. I didn't have time to simulate it yet.
P-25: Inter-Grey-Level Response Times of a Liquid Crystal Display (includes overdrive, without the need for LUTs)
The inter-grey-level response times of an LCD are studied using two different approaches: a 3-D finite-elements dynamic director orientation model and a simple firstorder RMS model. Both approaches are compared with measurements, showing that for certain applications, the RMS model is a quick and sufficiently reliable response time prediction tool.
http://www.researchgate.net/publication ... fe3471.pdf

LCD RESPONSE TIME ESTIMATION (using LUTs)
Techniques to reduce LCD motion blur are extensively used in industry and they depend on an inherent LCD parameter: response time. However, normative response time is not a sufficient reference to improve LCD performance. Rather, all the gray-to-gray response times quantities are required to obtain a good improvement quality. Consequently, we propose a novel LCD model to simulate as well as compute gray-togray transitions (response time and behavior) from a reduced
measurement set.
http://hal.inria.fr/docs/00/17/72/76/PD ... c_2006.pdf

Active Matrix Driving and Circuit Simulation (physics-based models)
http://www.intechopen.com/download/get/ ... s/id/24446

Dynamic Pixel Models for a-Si TFT-LCD and Their Implementation in SPICE (SPICE pixel simulation)
http://etrij.etri.re.kr/etrij/journal/g ... 3634366509


TRANSIENT SIMULATION OF AN A-SI TFT/LCD PIXEL USING TABLE-MODELING TECHNIQUES (LUT method, older paper)
http://www.tandfonline.com/doi/pdf/10.1 ... 99.9670445

Non-open access papers:
P-137: An Accurate Electrical Model of a Liquid Crystal Cell in Active-Matrix LCD
http://onlinelibrary.wiley.com/doi/10.1 ... 3/abstract
Timing Measurement and Simulation of a TFT-LCD Panel using Pixel Macro Models
http://onlinelibrary.wiley.com/doi/10.1 ... 3/abstract
35.1: Simulation Method to Calculate Effective Mobility of Pixel Switching TFT Devices for QXGA TFT-LCD Monitors
http://onlinelibrary.wiley.com/doi/10.1 ... 5/abstract

(Well, that took a lot longer to compile the list than to find the paper)

Edit: Here is the simple G2G response simulated (without overdrive, PWM)
Mind that Log here means natural logarithm
Image
Edit: A tried to update the model to account for backlights, but everything but 'perfect' LEDs get too slow in Mathematica.
I might try a numeric version in MATLAB later.
Image

User avatar
Chief Blur Buster
Site Admin
Posts: 11653
Joined: 05 Dec 2013, 15:44
Location: Toronto / Hamilton, Ontario, Canada
Contact:

Re: Seeking Math Formulas for phosphor decay & LCD GtG

Post by Chief Blur Buster » 09 Mar 2014, 18:42

ScepticMatt wrote:Edit: A tried to update the model to account for backlights, but everything but 'perfect' LEDs get too slow in Mathematica.
I might try a numeric version in MATLAB later.
Image
Just so you know, those black periods are too small.
LightBoost 10% = 1.4ms:6.9ms bright:dark ratio
LightBoost 100% = 2.4ms:5.9ms bright:dark ratio

Strobe lengths of various strobe backlights (at 120Hz, which is an 8.3ms refresh cycle).
Turbo240 -- ~2.3ms
LightBoost -- 1.4ms to 2.4ms
ULMB -- 2.0ms
BENQ Blur Reduction -- 0.5ms to 4.0ms (1.7ms default)

Also the response curves is faster for 1ms LCDs. The graph would represent a specific point on the screen. The curves (strobe compensated) are different for top edge and bottom edge of the screen, due to the asymmetry between the consecutive scanout, versus the all-at-once strobe. The transitions are fresher at bottom edge, than center of the screen.
Head of Blur Busters - BlurBusters.com | TestUFO.com | Follow @BlurBusters on Twitter

Image
Forum Rules wrote:  1. Rule #1: Be Nice. This is published forum rule #1. Even To Newbies & People You Disagree With!
  2. Please report rule violations If you see a post that violates forum rules, then report the post.
  3. ALWAYS respect indie testers here. See how indies are bootstrapping Blur Busters research!

ScepticMatt
Posts: 37
Joined: 16 Feb 2014, 14:42

Re: Seeking Math Formulas for phosphor decay & LCD GtG

Post by ScepticMatt » 11 Mar 2014, 10:57

Chief Blur Buster wrote:The curves (strobe compensated) are different for top edge and bottom edge of the screen, due to the asymmetry between the consecutive scanout, versus the all-at-once strobe. The transitions are fresher at bottom edge, than center of the screen.
That would be an easy fix, just set the delay to t = (scanout-period)*(current line/total lines) + initial delay
Anyway, I've completely redone the calculations, based on a more accurate model.
I'm now able to include transmission characteristics of different liquid cristals, overdrive and g2g speed dependence.
The parameters could all be totally wrong, some 'bugs' still need to be fixed and some limitations accounted for (TFT rise times etc.).
But here are some results.

Chosen Parameters:
Image

Results (full persistence/full persistence+pwm/low persistence)

Image

Here's an example of the limitations: It assumes zero rise time and ringing of TFT transistors.
Plot of no-overdrive voltage vs overdrive voltage vs internal voltage (with overdrive):
Image

User avatar
Chief Blur Buster
Site Admin
Posts: 11653
Joined: 05 Dec 2013, 15:44
Location: Toronto / Hamilton, Ontario, Canada
Contact:

Re: Seeking Math Formulas for phosphor decay & LCD GtG

Post by Chief Blur Buster » 11 Mar 2014, 11:15

ScepticMatt wrote:
Chief Blur Buster wrote:The curves (strobe compensated) are different for top edge and bottom edge of the screen, due to the asymmetry between the consecutive scanout, versus the all-at-once strobe. The transitions are fresher at bottom edge, than center of the screen.
That would be an easy fix, just set the delay to t = (scanout-period)*(current line/total lines) + initial delay
Anyway, I've completely redone the calculations, based on a more accurate model.
I'm now able to include transmission characteristics of different liquid cristals, overdrive and g2g speed dependence.
The parameters could all be totally wrong, some 'bugs' still need to be fixed and some limitations accounted for (TFT rise times etc.).
But here are some results.
This is impressive stuff.
I can immediately see with these three graphs, you modelled three graphs:
-- Graph for continuous backlight (high persistence, sample-and-hold)
-- Graph for PWM
-- Graph for motion-blur-reduction strobing (though strobing uses larger black duty cycles -- typically 75%+)

I notice you have a slight downward movement at the very top. It's more of a bounce ripple that's trying to stick to a straight line -- rather than a straight slope, much like overshoot/undershoot in squarewave voltage pulses before voltage stabilizes, rippling smaller and smaller over time (with the 1st ripple very obnoxious and then 2nd ripple essentially below visual noise floor most of the time -- http://www.blurbusters.com/faq/lcd-overdrive-artifacts/ ). LCD overdrive is kind of like that in some ways. There is some sloping (latent voltage decay in LCD pixels, especially at low refresh rates, e.g. GSYNC 30Hz) but often over a longer timescale than the ripple itself. From my observations, LCD pixel decay is visually more insignificant than ovedrive ripples which can overshoot massively in aggressive overdrive (sometimes to numbers almost double the original pixel target). Usually, good overdrive only ripples slightly (e.g. overshoots by about 5%, then undershoots by 1%, then visually stabilizes (rest of ripples below human vision "noise floor")), but often you see zero ripples for overdrive at some GtG color combos (e.g. transitions to full black/full white -- instead transitions is slowed down a bit since there's often no overshoot room), some ripples for some GtG combinations (e.g. most combos) and larger ripplers for other GtG combinations (e.g. transitions from very light colors to very dark colors, or vice-versa, very dark colors to very light colors, or both ways).

You could model only the first ripple due to this, although I have occasionally seen the second-order ripple occasionally (rarely -- it is extremely faint and easier to view during strobing -- via looking at strobe crosstalk during TestUFO offblue-offyellow moving bar test on a heavily overdriven monitor as well as on a strobed monitor -- I can barely see second-order and third-order overdrive ripples with this, trying all the ASUS TraceFree settings, BENQ AMA settings, as well as enabling/disabling strobing and looking at how the first ghost is lighter than blue and the second ghost is darker than blue -- that's the two ripples showing up during strobe mode)

The TestUFO moving bar test (8 pixels thick) and playing with the colors, is a great way to observe overdrive aggressiveness differences at different GtG values.

EDIT: Thinner (e.g. 2 pixel thick) can produce finer observations of the artifacts but can be much dimmer.

EDIT2: More Detailed Formulas for LCD GtG -- sent by ScepticMatt
Head of Blur Busters - BlurBusters.com | TestUFO.com | Follow @BlurBusters on Twitter

Image
Forum Rules wrote:  1. Rule #1: Be Nice. This is published forum rule #1. Even To Newbies & People You Disagree With!
  2. Please report rule violations If you see a post that violates forum rules, then report the post.
  3. ALWAYS respect indie testers here. See how indies are bootstrapping Blur Busters research!

Post Reply