Page 5 of 8
Re: CS2 Margin Graph
Posted: 10 Nov 2025, 22:46
by vnb
SammYrai wrote: ↑10 Nov 2025, 15:34
Sometimes if I reconnect 3-4 times I get better "Receive margin (ms)" values at the end of the match but it feels like a lottery.
The margin graph actually showing green and no red/yellow doesn't tell the whole story, the height of the green bars should technically display how big the recv. margin is or am i wrong?
I actually want to see if I can tell ingame if it's good or bad with "cl_ticktiming 640 detail" this should give you all the stats offer the last 10 seconds (1tick = 64). You should be able to see the margin there.
I can only test on tuesdays and thursdays (Esea-league) since I'm not playing normal faceit with this crap and ruining the match for others, and it's often different servers.
If you want to read up on the ticktiming info here:
https://www.reddit.com/r/GlobalOffensiv ... icktiming/
also read the top comment.
Okay keep us updated!
I would avoid looking to much at the "downstream recv margin" if i was you. keep a close eye on the CS margin graph because it is a feed in real time. Your values are very good. the 75% below recv margin you are getting it because your numbers stays at 04 (anything below 05 will count as below recv margin). in my personnal testing this has no real negative impact on gameplay (as FletcherDunn said) -- The network engineer working at Valve. The problematic value is the upstream one why? :
food for thought from your link :
 "In subtick, input is timestamped the instant you click or press a button, but if the out time* is high, there's a significant delay between the clicking and the server actually receiving the information. The server knows when one clicked, but it finds out about it late. This delay is what creates the disconnect between what you see and what the server registers, leading to those frustrating "desync" moments. Same with movement inputs. "
*out time = client to server; or upstream
In my personal testing the yellow lines on the CS margin graph (the graph under jitter lines) is the most interesting because at soon as i get too much yellow lines (low in height) i start to feel like i get de-synced with the server and the gameplay is really bad, even dervu above shared the same feeling
Re: CS2 Margin Graph
Posted: 11 Nov 2025, 07:40
by dervu
vnb wrote: ↑10 Nov 2025, 22:26
thank you for sharing, are you sure you have not mixed up the screenshots?
Because in the first link where you say bad gameplay you have
bad cs margin graph but good recv margin values in latency breakdown, so i was somehow correct in saying that
cs margin graph giving better feedback before you streered the topic to the latency breakdown

in the second link you have too much below recv margin values but you say good gameplay; so once again if you can confirm that you did not mixed up the screenshot = then we know for a fact that the CS margin graph is more precise in giving you the situation in real time...

recv margin at end of game is unreliable imo, because you could have perfect connection for 30min with perfect numbers then if you have sudden packet loss / issue it give you bad result in total because of that. CS margin graph = live feed which is better because you can monitor in real time
No, they are not mixed. I created folders and went with one by one, so it can't be mixed.
I think you are guessing right. It is more about change in time (jitter) of those values rathen than complete count at the end.
Re: CS2 Margin Graph
Posted: 11 Nov 2025, 10:02
by vnb
dervu wrote: ↑11 Nov 2025, 07:40
vnb wrote: ↑10 Nov 2025, 22:26
thank you for sharing, are you sure you have not mixed up the screenshots?
Because in the first link where you say bad gameplay you have
bad cs margin graph but good recv margin values in latency breakdown, so i was somehow correct in saying that
cs margin graph giving better feedback before you streered the topic to the latency breakdown
in the second link you have too much below recv margin values but you say good gameplay; so once again if you can confirm that you did not mixed up the screenshot = then we know for a fact that the CS margin graph is more precise in giving you the situation in real time...
recv margin at end of game is unreliable imo, because you could have perfect connection for 30min with perfect numbers then if you have sudden packet loss / issue it give you bad result in total because of that. CS margin graph = live feed which is better because you can monitor in real time
No, they are not mixed. I created folders and went with one by one, so it can't be mixed.
I think you are guessing right. It is more about change in time (jitter) of those values rathen than complete count at the end.
i still don't get the whole picture, yet. I know for a fact that those yellow lines we are getting in the CS margin graph (top right corner of your monitor) are not exactly related to the "below recv margin data". Because sometimes i get 45% below recv margin and my game run perfectly fine -- full green; no yellow lines.
But the issue arise when those yellow lines (usually low in height) start to show up in the CS margin graph and slowly with time as they build up you start to feel more and more de-synced with the server

and the only way to know is to keep an eye on the CS margin graph because it is a feed in real time.
Like you said earlier; I noticed that some servers with beefier CPU like the DM ones from Cybershoke don't feel as bad as others. Maybe it can "compensate" better the bad internet connection of players thanks to it's higher processing power, so even if my connection is "bad" the gameplay still feel good?
I think those yellow lines are some kind of instability? ISP jitter? from the upstream side (client to CS server) but no definitive answer yet, i am still in the process of figuring this out... Thing is with fiber we have way less access to data / tools to check if the connection is healthy like on coax so it only make things harder to figure out...
Re: CS2 Margin Graph
Posted: 11 Nov 2025, 11:52
by dervu
From my perspective it looks like two servers have different routing and packet timing is worse for one. If it's more than that I have no idea.
I did some measurements with wireshark:
All data based on "Time delta from previous displayed frame" - so difference in timing between packets, all downstream.
PPS - Packets per second

Re: CS2 Margin Graph
Posted: 12 Nov 2025, 05:03
by urikawa
hello if its routing that the problem can you try
net_client_steamdatagram_enable_override 1 and 0 with the same wireshark capture ?
some people talk about net_client_steamdatagram_enable_override -1 to stop routing through valve internal network
Command from cs2 vars already existed in csgo
https://developer.valvesoftware.com/wik ... _variables
Re: CS2 Margin Graph
Posted: 12 Nov 2025, 06:31
by dervu
I mean those are not valve servers.
Re: CS2 Margin Graph
Posted: 12 Nov 2025, 13:06
by urikawa
this command share to the client the udp datagram for the routing path through the steam peering instead of public peering for the server access. I understand your wireshark capture u didnt mesure packet loss with valve servers. But for cs2 margin maybe it could help
Re: CS2 Margin Graph
Posted: 12 Nov 2025, 16:59
by Kal


how bad is this?
Re: CS2 Margin Graph
Posted: 12 Nov 2025, 22:53
by vnb
Kal wrote: ↑12 Nov 2025, 16:59
this is the jitter graph, not the margin graph...
to enable margin graph put this in console : cl_hud_telemetry_serverrecvmargin_graph_show 2

Re: CS2 Margin Graph
Posted: 15 Nov 2025, 00:21
by vnb
OKAY
Very important update! :
I found the culprit to my issue : upstream UDP jitter
Here is the proof :
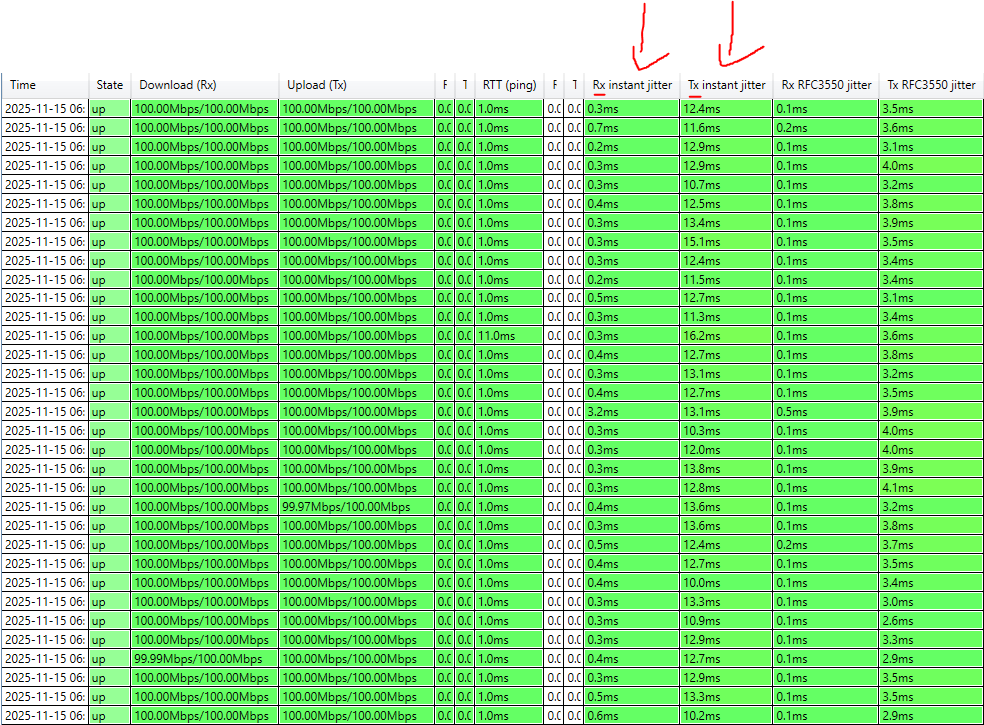
- upstream jitter capture.PNG (139.04 KiB) Viewed 680 times
So even though my XGS-PON Fiber connection is 2Gbp/s UP and Down capable, this is only a 100mbp/s symmetrical test.
As you can see the result above the RX latency (downstream) stays under 1 ms but the TX latency (upstream) is never below 10ms and the value varies a lot which is not good. So waveform bufferbloat and most other "tools" to measure latency are not giving us the full pictures and can somehow overshadow the "raw results" of your ISP... Case closed. Now time to "fight" with my ISP wish me luck

Conclusion
: i found the culprit to the low in height yellow lines in the CS margin graph after months of research and testing, Valve network engineer and other ppl on twitter and reddit that consider themselves "expert" on the matter were not able to give me a conclusive answer.
well good news if you have the same issue as me (too much yellow lines low in height in cs margin graph) even tho you have no packet loss or bad network values, well the issue is
upstream UDP jitter as shown in my screenshot above.