Page 5 of 5

Re: CS2 Input Lag Explained - The Monolithic 64 Hz Client Simulation Tick Stalls the Render Thread

Posted: 08 Oct 2026, 17:13
by unconnected
Ok, I finally had time to analyze CS2 thread calls with Superluminal.

Image

The core issue is a synchronous Fork-Join barrier inside the engine: the Main Thread splits jobs across worker threads and has to wait for all of them to finish before proceeding with the render pipeline. While it waits, the GPU simply runs out of commands to draw.

Look at the Blocking stack in the bottom left:
  • engine2.dll: Source 2’s core loop coordinating the current frame
  • scenesystem.dll: The scene renderer trying to process visibility, objects, and draw lists
  • tier0.dll!0xA4CF5: (The bottleneck) Valve’s low-level threading library. This function is an explicit job barrier that forces the thread to stop and wait for worker tasks to complete
  • KernelBase.dll & ntdll.dll (ZwWaitForMultipleObjects): CS2 explicitly asks the Windows kernel to put the thread to sleep until all handles are signaled
  • ntoskrnl.exe: Windows suspends the thread into the Synchronization state.
The scene thread sits frozen for up to 1.9ms (on my rig) on each barrier. It only wakes up when the slowest worker in the pool finishes its job.
Because this happens synchronously inside scenesystem.dll, render submission completely stops. The GPU finishes rasterizing in ~1.2ms, runs out of draw calls, and goes into starvation (MsGPUWait).

This confirms it’s an internal synchronous design flaw inside Source 2, not driver overhead or system latency.
Archaic engine design from a multi-billion dollar company... insane.

Any ideas on how to push this publicly to force Valve to decouple the render queue from the main thread?

Re: CS2 Input Lag Explained - The Monolithic 64 Hz Client Simulation Tick Stalls the Render Thread

Posted: 08 Oct 2026, 18:47
by cuaderno
Thanks for doing the research.

Best way to get publicity is on r/cs2 or r/globaloffensive, but be ready to deal with all sorts of insane posters. If you just want to bring attention of this to Valve, the e-mail should be sufficient. Decoupling doesn't seem easy to implement.

Re: CS2 Input Lag Explained - The Monolithic 64 Hz Client Simulation Tick Stalls the Render Thread

Posted: 08 Oct 2026, 19:12
by kyube
unconnected wrote: ↑
08 Oct 2026, 17:13
This confirms it’s an internal synchronous design flaw inside Source 2, not driver overhead or system latency.
Archaic engine design from a multi-billion dollar company... insane.
It's too soon to call it a flaw of the entire engine.
Have you tried profiling Deadlock, Dota2 & CSGO?
In CSGO, you have more choices in terms of tick rate, assuming that game follows the same pattern CS2 has.
More data using different system configurations would also be satisfactory.
Ideally .etl-based data.

Re: CS2 Input Lag Explained - The Monolithic 64 Hz Client Simulation Tick Stalls the Render Thread

Posted: 10 Oct 2026, 02:34
by unconnected
kyube wrote: ↑
08 Oct 2026, 19:12
It's too soon to call it a flaw of the entire engine.
Have you tried profiling Deadlock, Dota2 & CSGO?
In CSGO, you have more choices in terms of tick rate, assuming that game follows the same pattern CS2 has.
More data using different system configurations would also be satisfactory.
Ideally .etl-based data.
I'm not sure if you are any familiar with game architecture design but here's the most simple explanation:

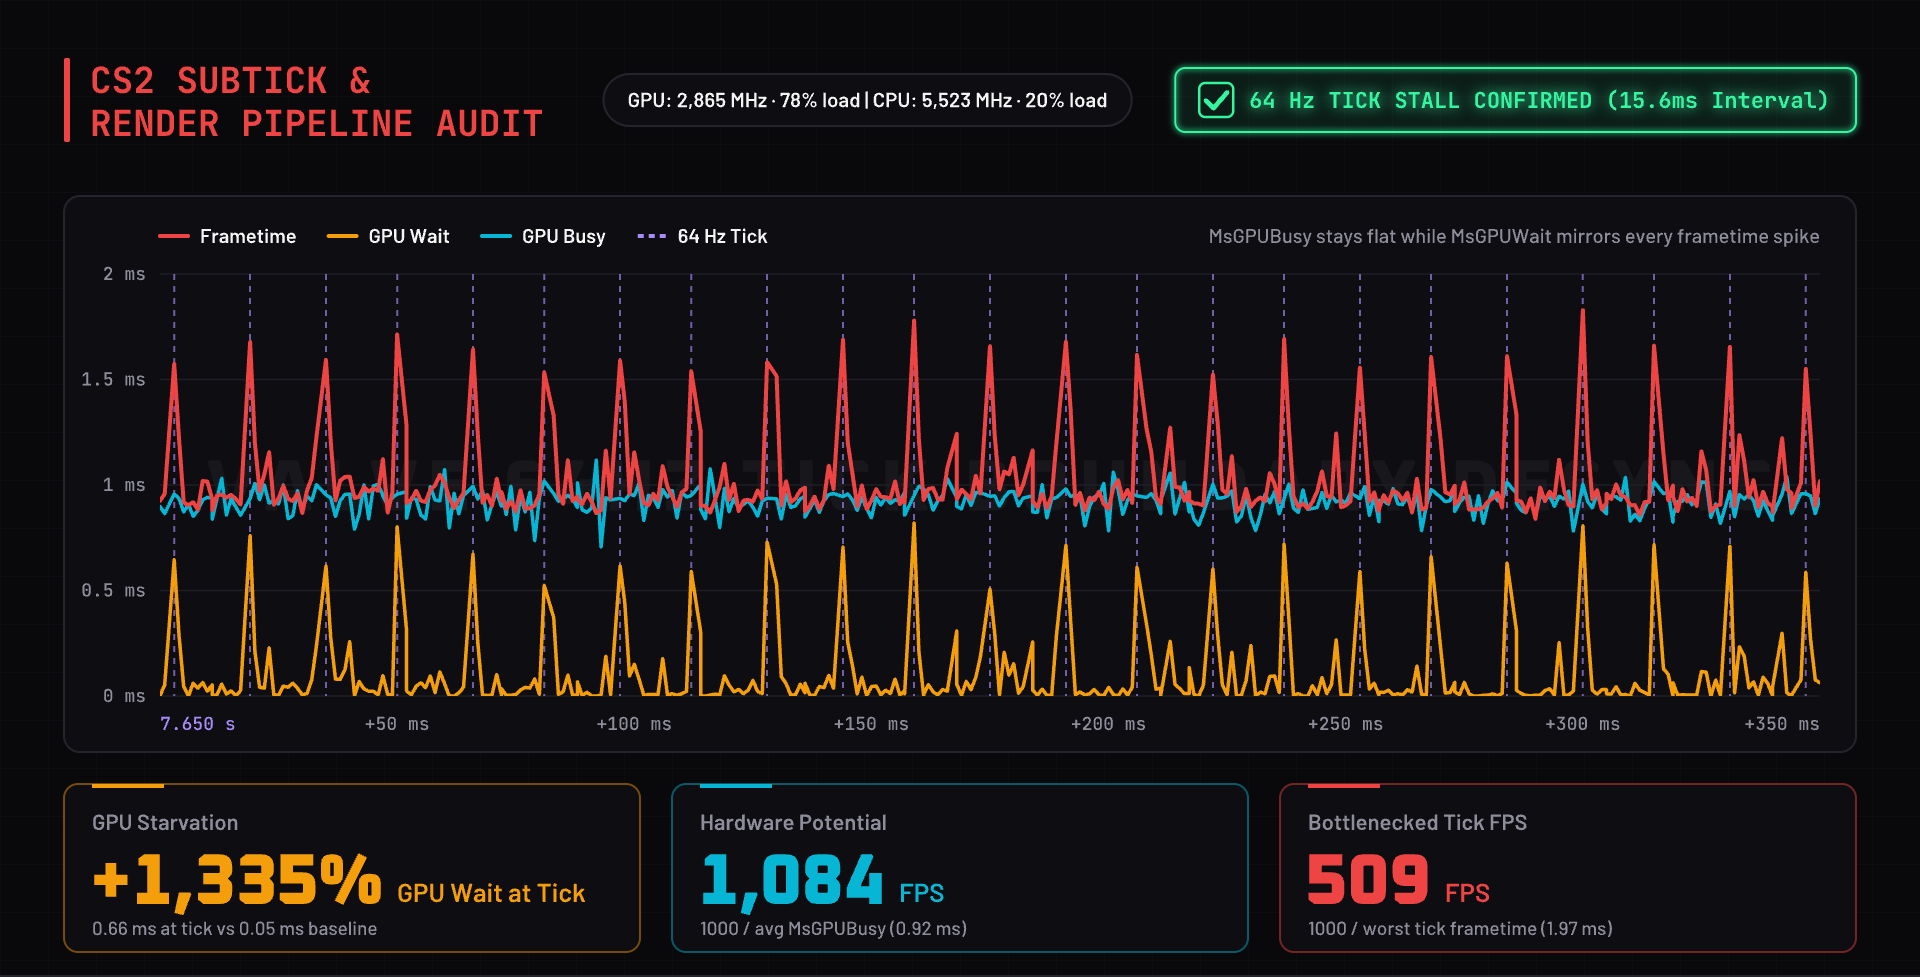
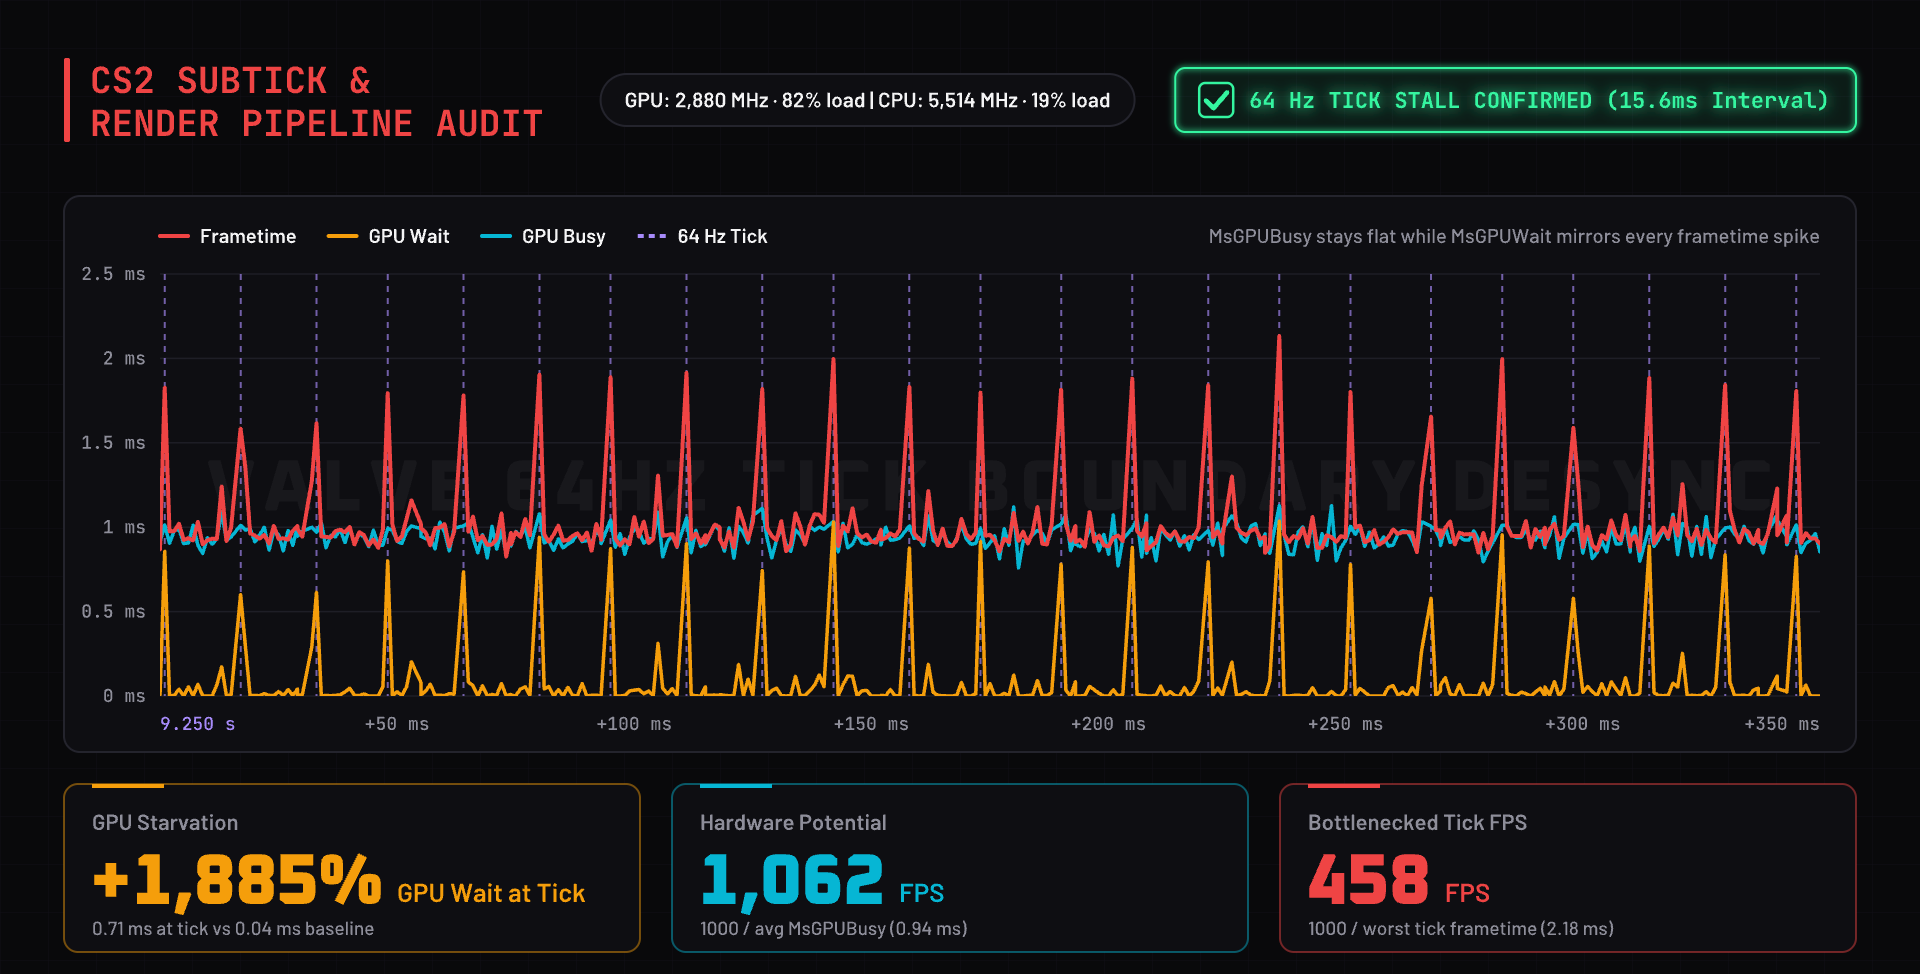
CS2's engine has an orchestrator of the game that's called Main Thread, it delegates tasks to workers pool (sub threads) and has to wait for all of them to complete before proceeding with the next frame draw. The hardest workload happens to be when the client is hit with server tick as it has to dispatch and send back netcode data, apply positions, animations, vectors ecc. Because of that frame time suffers, making the overall experience bad. BTW: when main thread is frozen the inputs polling is also not working, that's why crosshair feels like mud.

Here is a demonstration:
Dedicated cs2 server on my home server with default config of linux gsm, 9 bots moving back and forth while I am standing still.
Baseline
Injected 2% packetloss (just because it happens quite often on some faceit servers)
I was unable to inject jitter but 90% of the people suffer from it during peak times.


This is a multithread approach from the mid 2010's to 2015's, but soon discovered to be inappropriate for game design.
There is an entire book and gdc talks explaining why all this is the worst thing to be.

Different system configurations have nothing to do in this, neither etl tracing as you'll just see the workers doing their job while the main thread is frozen holding the frame hostage.

Here's also Kaldaien's (father of Special K) take on this:
Image

Re: CS2 Input Lag Explained - The Monolithic 64 Hz Client Simulation Tick Stalls the Render Thread

Posted: 10 Oct 2026, 08:14
by kyube
unconnected wrote: ↑
Today, 02:34
CS2's engine has an orchestrator of the game that's called Main Thread, it delegates tasks to workers pool (sub threads) and has to wait for all of them to complete before proceeding with the next frame draw. The hardest workload happens to be when the client is hit with server tick as it has to dispatch and send back netcode data, apply positions, animations, vectors ecc. Because of that frame time suffers, making the overall experience bad. BTW: when main thread is frozen the inputs polling is also not working, that's why crosshair feels like mud.

Here is a demonstration:
Dedicated cs2 server on my home server with default config of linux gsm, 9 bots moving back and forth while I am standing still.
Baseline
Injected 2% packetloss (just because it happens quite often on some faceit servers)
I was unable to inject jitter but 90% of the people suffer from it during peak times.
I don't trust your LLM-based slop site for any form of validation of a pattern.
Use other plotting tools which make use of msBetweenPresents or msBetweenDisplayChange.
unconnected wrote: ↑
Today, 02:34
This is a multithread approach from the mid 2010's to 2015's, but soon discovered to be inappropriate for game design.
There is an entire book and gdc talks explaining why all this is the worst thing to be.
That book does not have a single quote of what the GDC talk is talking about. Feel free to CTRL+F through it.
The GDC talk & mention of Superluminal are nice finds though, thanks for those!
unconnected wrote: ↑
Today, 02:34
Different system configurations have nothing to do in this, neither etl tracing as you'll just see the workers doing their job while the main thread is frozen holding the frame hostage.
It's about reproducability on different systems.
ETW is the objective truth about programs on Windows, which PresentMon-based tools rely upon.
The more (good) data one has, the higher likelihood that a bug report to Valve would get looked at in regards to this potential issue.
unconnected wrote: ↑
Today, 02:34
Here's also Kaldaien's (father of Special K) take on this:
Image
That answer is a surface-level bias towards D3D12 / VK through DXGI because of his personal preference.
Irrelevant answer to the question you've given him, as per usual from Kal.

Re: CS2 Input Lag Explained - The Monolithic 64 Hz Client Simulation Tick Stalls the Render Thread

Posted: 10 Oct 2026, 08:58
by vnb
this is absolutely not an "engine flaw", sadly it is purposely put in place.

the spikes (MsGPUWait) are directly related to a command in CS2 console : cl_tickpacket_desired_queuelength

the default value for this command is "0" which is equal to an upstream recv_margin of 5ms. Currently servers are not able to keep up with values under 8ms.

How can you test this?

first you need to understand your buildinfo (bottom left corner)
buildinfo.jpg
buildinfo.jpg (5.21 KiB) Viewed 29 times
XX-PING-YY-AA-BB

S = community server / V = Valve official server
XX = upstream margin
PING (here shown as 14)
YY = downstream margin
AA = downstream packet loss (% times ten, over 9.9% shows as 99)
BB = upstream packet loss (% times ten, over 9.9% shows as 99)

what we need to focus on here is the XX value. Whenever that value is under 08 (recv_margin 8ms) so 07 or 06 the server will make your client slow down by stalling your render queue (hence the MSGPUWait spikes).

Good news is you can artificially raise your render queue by typing this in console :
cl_tickpacket_desired_queuelength 0.3 -> or any value higher than 0; like 0.5 etc.

By doing so in the bottom left corner you should see your XX number going up.

Remember at the beginning i said servers are not able to keep up with upstream margin values under 8ms so if in your buildinfo your XX number falls under 08 -->to 07 or 06 that is exactly when the spikes (MsGPUWait) starts to appear, the server is simply slowing you down by stalling your render queue.

This can also be seen with command cl_hud_telemetry_serverrecvmargin_graph_show 2 each short yellow lines will exactly correlate with a spike (MsGPUWait) in the graph.

If you don't want to have spikes just artificial raise your render queuelenght by using cl_tickpacket_desired_queuelength 0.3 or higher.

note : cl_tickpacket_desired_queuelength is only working in community servers, this will not work on official valve servers, where 64hz client is forced no matter what!

EXAMPLES: (look at bottom left numbers and top right margin graph)

05 upstream margin yellow lines correlate perfectly (with MSGPUWait spikes)
05.jpeg
05.jpeg (466.66 KiB) Viewed 29 times
08 upstream margin no yellow lines = (0 MSGPUWait spike)
08.jpeg
08.jpeg (504.64 KiB) Viewed 29 times

Re: CS2 Input Lag Explained - The Monolithic 64 Hz Client Simulation Tick Stalls the Render Thread

Posted: 10 Oct 2026, 09:30
by Moontrance
kyube wrote: ↑
Today, 08:14
I don't trust your LLM-based slop site for any form of validation of a pattern.
Use other plotting tools which make use of msBetweenPresents or msBetweenDisplayChange.
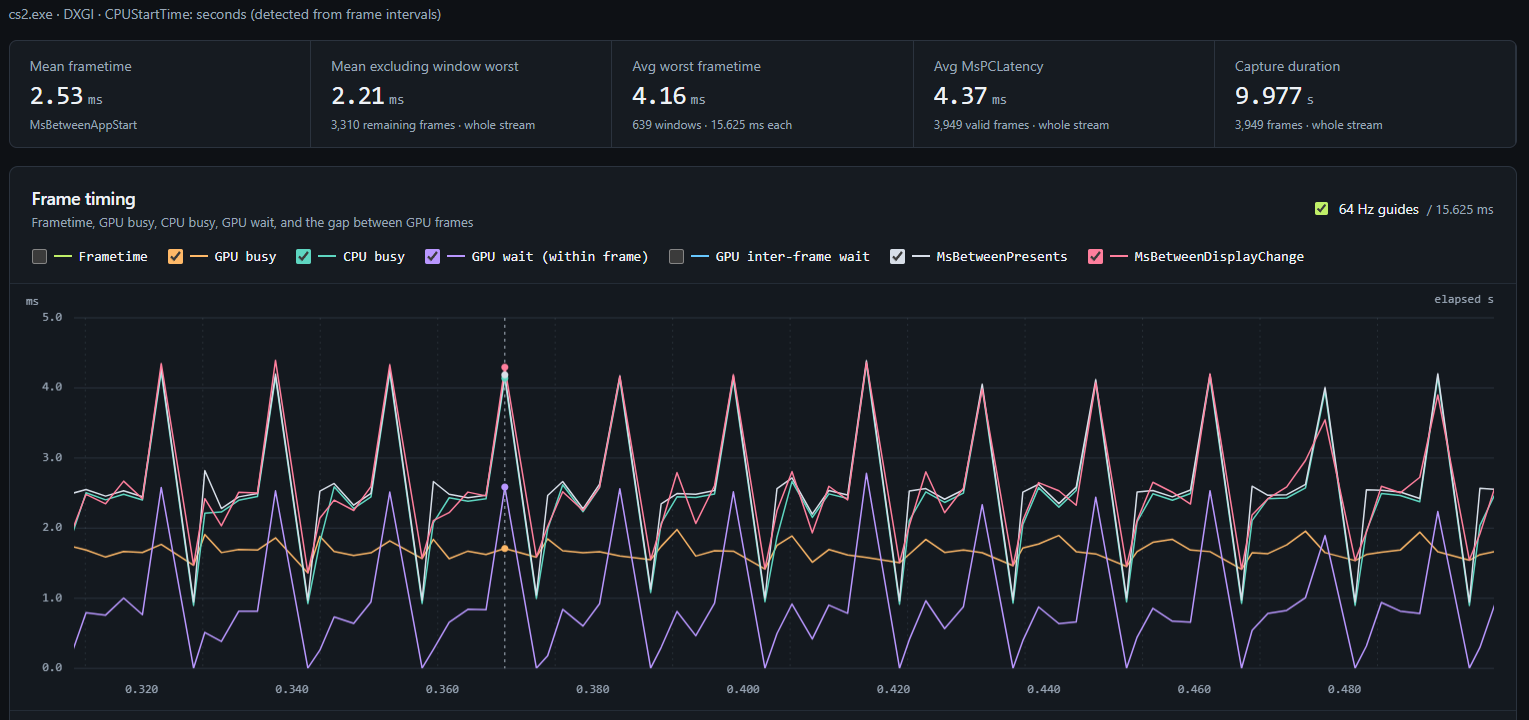
If we all agree PresentMon is a valid measurement tool, I don't understand your criticism about "LLM-based slop plotting".
I did my own measurement and plotting before unconnected published his tool. My llm-based slop has both msBetweenDisplayChange and msBetweenPresents. Pattern is very obvious, doesn't matter what you use for plotting, doesn't matter what metric you plot.
Image
If you don't like it, you're free to do your own measurement and plotting.

Although I agree Kal's answer is offtopic, question itself seems weird to me. If we assume render pipeline being blocked by network processing, this is not a multithreading issue. IMO, the only option is to make network processing async or as lightweight as possible.
Knowing it's Valve I understand it's not possible in any foreseeable future, so I'm looking for a bandaid fix instead.
I don't really understand why fps cap introduces even more spikes instead of smoothing everything out. Those spikes are all withing ~2ms when playing uncapped, so I expect fps_max 500 to make it playable, instead of that it introduces extra delay for all frames and it makes spikes ~4ms instead. I think this is something Valve could realistically fix soon (in 2 years).