spacediver wrote:I understand that, but why would persistence be an issue in my scenario?
I am not 100% sure I get what you're trying to say because I don't always understand things spoken in a specific way.
...but you could visit my place and allow me to show you what I mean.
So let me try to explain behavior, so you can do informed scientific testing:
My post will help you extrapolate behavior based on:
"How does image retention/persistence work through successive solid color/white refresh cycles, after an image?"
"How does image retention/persistence work if several preceding refresh cycles were solid color/white, rather than just a few?"
"How does image retention/persistence work with successive images going back and fourth?"
"How does image retention/persistence work based on how many preceeding(or succeeding) refresh cycles were solid color/white?"
When looking at motion tests under specific conditions (that most scientific people don't test for), I can really tell that there is a stepped behavior to persistence. It's the type of stuff more easily seen by human eye than an oscilloscope -- consider an oscilloscope trying to map over 8-bit of greyscale -- 256 greyscale levels, but that sometimes the human eye can tell apart far, far, far, more than 256 luminance levels if they are ultra-wide dynamic range, from the very dim (eyes adjusted to dark, faint light), all the way to blindingly bright (like staring directly at the sun). So if you mapped over such a wide dynamic range, your eyes can really tell far more than 256 luminance levels, allowing eyes to adjust. An oscilloscope graph only 1 inch tall, a 1/256th difference in height would be hard to see, so oscilloscope graphs are currently not too useful for this specific use case, here unless you're using a very tall/logarithmic graph, or
knowing what you are looking for & zooming into a specific section at different stages of LCD response, rather than mapping the whole LCD response.
Normally looking at test patterns without strobing, it's hard to see the stepped behavior (multiple-hump-curve effect). So let's include photography.
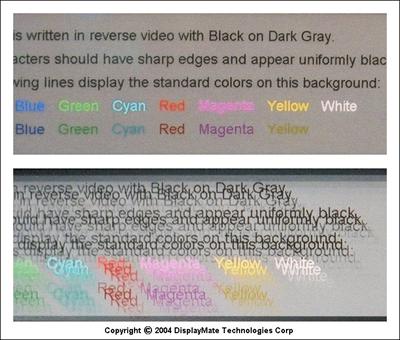
Ghosting without strobing

- Lots of motion blur, and you see a ghost trail to the left. The stepping effect of the voltage kicks is extremely hard to see, but if you put an ultrahigh-precision photodiode oscilloscope (accuracy far more than necessary to tell apart adjacent shades), a stepping effect of each refresh cycle should become visible.
Ghosting as part of Strobe Crosstalk

- No motion blur, but the existing ghost trail is now "chopped up" in the form of strobe crosstalk. You see the stepped effect much more clearly, thanks to the human eye. Most of this is caused by the strobing itself, but this is an excellent illustration of how each successive step gets closer and closer to the final color value, until closeness is so close that it falls below the vision noise floor...
....So now that out of the way, let's forget about oscilloscopes because most normal use of the oscilloscope won't always reveal what the human eye sees, in a strobed blur trail test (and I doubt most scientists have tested strobe backlights much, which amplifies the human eye's ability to see any imperfections in LCD response leaking between refrehes)
So now that out of the way, let's start with an explanation which might help you extrapolate your scenario (that I may not fully understand), based on what I explain.
There's a stepped behavior in LCD response. Each voltage pass (LCD scanout) is a kick of momentum that pushes the LCD pixel closer to its final color value. Overdrive may cause overshooting (coronas) or undershooting (ghosting) but often both (aka squarewave ripple)
So picture it this way. (I'm picking numbers out of thin air, only to explain the point -- but the numbers would vary)
Several refresh cycles were white, but now next refresh has an image.
1 - first scanout pass kicks the LCD pixels suddenly towards the image. Pixels manage to reach 98% of the way to their final value, in a curving behavior. This is easily seen in oscilloscope graphs.
2 - second scanout pass kicks the LCD pixels suddenly from 98% to 99.5% accuracy and it keeps costing slowly (e.g. in the scale of 0.001). The scale of ~1/60th differences in luminances -- this can still be barely human visible, for certain shades, especially when testing blur trail in strobed mode -- but a 1/60 height difference is already hard to see in a 1-inch-tall oscilloscope diagram
3 - third scanout pass kicks the LCD pixels suddenly from 99.5% to 99.99% accuracy -- this may still be human visible, as it's roughly a 1/200th difference in luminance, and tests have shown that people can tell these apart in certain conditions. (tip: strobed test, using medium-scale greyscale, since accuracy is more variable with midrange greys than with full-black and full-white). At this level, a 1/200 difference in height might be extremely hard to see in the oscilloscope, even if it may still be visible to human eye
4 - fourth scanout pass kicks the LCD Pixels suddenly from 99.99% accuracy to 99.999% accuracy; well below the noisefloor of other LCD phenomenae, inversion, signal noise, etc...
Between each voltage push, is a curve going towards the final pixel value. During voltage, a new acceleration occurs (so if you zoom oscilloscope to that tiny slice, and expand height). This is so faint, though, and wouldn't show up in oscilloscope graphs except when displayed inverse-logarithmic (I think that's the term) and if everything was so crisp/accurate that noise was a tiny fraction of the difference between adjacent greyscales (e.g. greyscale shade 253 greyscale versus shade 254). The dim greys are easier to tell apart (e.g. greyscale shade 3 and greyscale shade 4), but we also run into the 6-bit TN panel limit, so a lot of shades may look the same at the low end -- see
Lagom Black Level -- make sure bright light sources are off, and you maximize your browser window to hide the bright UI elements -- then you can often tell apart adjacent greyscale levels easily. This is hard to see in an oscilloscope graph, unless you expand the low parts of the graph logarithmically (inverse log).
However, I would say on an ultra-sensitive ultra-accurate oscilloscope (accuracy far more sensitive than adjacent colors -- e.g. more than, say 10x more sensitive necessary to accurately tell apart adjacent colors, such as greyscale 235 versus greyscale 236), on a logarithmic graph (assuming no 'noise' from inversion, dithering, etc) that expanded more and more as fractions got smaller and smaller (I think "inverse logarithmic" is the phrase -- I hope I got it right) you would see a multiple-humped graph. You'd have to clamp off/cut off the log scale at the bottom, since it would be infinitely tall as the number approached smaller fractions. You'd suddenly reveal the multiple-hump-curve appearance of the multiple LCD pixel momentum events, as each scan pass kicked the LCD pixels ever closer and closer to final value. You won't see this in typical oscilloscope tests of LCD response, and most people don't "think from the Blur Busters perspective" like I do, and because I'm targetting the mainstream with Blur Busters, my language isn't very scientific. So sometimes I need help from people like you, peer reviewers, to tidy up my language --
Another thought experiment to understand this better: Think of it like expending exactly "X" of energy to accelerate, everytime you approached the speed of light. One acceleration event goes to 90% of speed of light, next acceleration event goes to 99% of speed of light, next acceleration event goes to 99.9%, etc. Vanishingly smaller and smaller points of returns. You needed several refresh cycles for a 33ms LCD to get these points of diminishing return, but now only need about 1 refresh cycles of good well calibrated overdrive on a ultra-well-calibrated LCD, to already get to the diminishing return.
It doesn't matter whether the pixel started at color X, and the next is color Y. Multiple refreshes of white followed by stimuli. Or stimuli followed by multiple refreshes of white.
And if your concern is related to "how does those partially-refreshed pixels behave for the next pixel change", then picture of it this way. If you had a solid white screen followed by an image, and the pixels was only 98% accurate (e.g. 98/100ths all the way to an exact shade of grey - e.g. a grey shade slightly too light), then the behavior of that LCD pixel tends to be the same as if the pixel was already at a specific lighter grey color. So the next refresh will begin the momentum from that level, as if the screen was already intentionally refreshed to that slightly lighter shade of grey. On typical 1ms LCDs, the LCD momentum coasting is already flattened out, so pushing the pixel at the next scan, will be as if the pixel was already at its slightly lighter shade.
If your concern is related to vision science, then describe a specific test case (in layman's language, if possible). Typically, if you've been already displaying a specific image for several refresh cycles, the persistence won't factor into an inaccuracy. If it's about displaying whiteness, followed by a single frame of image, then back to white frame, what you're getting is a partial transition to the image (pixels never quite reaching their final value) and then back. On slow LCDs, this may mean an image that's only 10% ghostly. On faster LCDs, this may mean an image about 98% or 99% as strong as the original. Conversely, if it's a sequence of single-refresh-cycles images displayed in rapid succession, they will ghost into each other. And completeness of transition of each pixel can also depend on whether it's a "slow" color (e.g. dark grey or light grey, one of the two is often slower than others, especially on VA) or a "fast" color (e.g. solid white or solid black). If it's a 1-bit monochrome stimuli (no antialiasing, etc) you've got the best case scenario as black-to-white and white-to-black transitions are often more accurate, have less pixel ripple at the ends, and can often go directly without overshoot, since it's a totally of all LCD molecules being aligned one direction or another -- without possibility of going below black or above white). You'd want bidirectional overdrive, for fast-to-black and fast-to-white. Most new 120Hz+ monitors as well as scientific models like Viewpixx/etc, I believe, already use bidirectional overdrive (don't vouch me on this). For other scenarios, you will have to extrapolate based on my explanations.
Different displays will be different. And overdrive muddy the questions a lot. The first pass may have an overshoot past. The next voltage pass (if pixel color value unchanged between the subsequent refresh passes) is not overdriven. So in this case, you've got an overshoot (and ripple) followed by a multiple-hump effect of each voltage push towards the correct color value. Overdrive lookup tables is often only 1-refresh-depth, making an assumption that the pixel colors are of perfect final value on the next pass. Let's say a specific panel's overdrive quirk causes undershoot during upwards transitions but overshoot during downward transitions. (Or vice versa. Or even for certain color values -- overshoot occurs on certain colors but undershoot on other colors!). So if you've got a stimulus then back (light grey then dark grey then back to light grey), you may have a double or amplified overshoot, such as the final pass (light grey) overshooting far more severely than if the refresh sequence was darkgrey-darkgrey-darkgrey-lightgrey, because lightgrey-darkgrey only transitioned partially to darkgrey. But the overdrive back to lightgrey assumes the pixels were already fully transitioned to darkgrey. Since you're starting off from a lighter-than-expected pixel, the overdrive would then more heavily overshoot than usual, creating a much stronger corona than usual. Yes, yes, it's a headache of complexity.
Now, I don't think I can answer any further questions about this -- as I think I've explained it out as much as I could -- you will have to extrapolate from here onwards....
...If you need to measure this effect for scientific purposes I really suggest you buy equipment as I don't have the equipment to measure this. You need something accurate enough that's more than an order of magnitude more accurate than the luminance difference between two adjacent greyscales of 8-bit, AND you need inverse logarithmic graphing (hope that term is correct) to clearly show the multiple hump curve effect of the multiple voltage kicks of subsequent scanouts. Or if it's an issue of understanding the stepped effect, the option is test the same test on a strobed display to check out the phenomenae, while I drew pencilled graphs of what's really happening on the screen. Then scientists can follow a precise procedure to get it graphed on paper.
It could muddy certain vision science questions such as the "do you see a bright flash optical illusion when the image flickers to dark and then back?" question, because overdrive might very well be responsible for a surge of brightness, rather than trying to measure a human brain stimulus. So, I can understand why you might be askng these kinds of questions, because various behavior of LCDs can affect science. So one wants to back it all up with verification measurements from a high-precision oscilloscope (knowing that bumps not visible on normal non-logarithmic graphs, as explained previously, may actually be seen by the human eye, knowing the logarithmic nature of the human eye's dynamic range).
I may split this thread off to a separate thread, in Area 51, to keep the simplicity of the "motion blur in old photography".
 )
) (taken from the following open access paper: